Kirill's SPSS Macros Page
Here you can find some original SPSS macros — programs written in IBM SPSS Statistics user command language, and useful for those who process data by this statistical package.

Some instructions and information
- Please do read before you use: about SPSS macros
- The complete list of the macros
- About the macros’ author
- Other resources on SPSS: links
Kirill’s SPSS macros page nests a separate corner on spsstools.net, the greatest SPSS programming resource, owing to Raynald Levesque (creator) and Anton Balabanov (director). Despite being a part of the site the page is “stand-alone” and is directed by its own creator, Kirill Orlov.
Please do not publish any of these macros themselves or their description documents without the consent of the author. But use them freely. Please make a credit note when you share them or report their usage.
In the descriptions that you download with the macros not everything is in English. Macro calls and most principal other portions have been annotated in English (for the most part, this is enough to use a macro). The rest of the description text that may contain nuances is still in Russian. I hope to translate it later.
Slight revisions of the macros can pass without notes of update on the page or in the descriptions. Please don't hesitate to report any bugs you've found or to bring ideas or proposals. I’ll be glad with your feedback.
Run the macros from menu dialogs as well
In addition to running from syntax window, you can also run some of my macros from menu dialogs of SPSS Statistics (version 24 or higher with Integration Plug-In for Python 3 installed). Just download and install this Extension Bundle: KO_macros.spe. This is version 7, and more macros (procedures) are planned to add in it with future releases of the Extension Bundle.
Here are the collections of macros

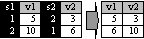
Categorical — Binary recodings
Recoding categorical variables into binary or vice versa. Collection of macros for conversion categorical data into binary data or back; for example, creation of dummy variables or turning multiple response sets MRC (categorical multiple response) and MRD (dichotomous multiple response) – one type into another.

Multiple Response tools
Tools for multiple response sets. Collection of diverse macros to work with variables of multiple response sets – categorical sets (MRC) and dichotomous sets (MRD), except for recoding them one into another (look for that in “Categorical – Binary recodings” collection).

Series Response tools
Tools for series of items. Collection of macros for a “simple matrix question”, i.e., a series of variables with a common pool of alternative responses (Single response series, SRS); for example, a set of items each scored by rating scale or ranked. One of the macros is for the data respondents ranked and it shifts the variables into the categorical multiple response set or back. Another macro is intended for more general tasks of translating values and variables into each other as well as for calculating on reduplicating values. The third macro is for a situation when respondents rated not all items but only those they had chosen before, and the rating data having been entered in a packed (quickened) mode.

Horizontal tools
Some horizontal operations. Collection of macros performing some wanted things (such as standardization, sorting, ranking, binning or counting up frequncies or unique values) within cases, horizontally.
Derandomize tasks
Derandomizing of tasks. If same tasks (some stimuli, e.g. questionnaire questions, specimens being tested, or medical treatments) were offered in different sequence to different respondents, so that the data, too, were then entered in that order of exposure – “order of trials” – then the macro will restructure these data into a unified “order of tasks” wherein each variable contains data of only one task.

Frequency weighting
Frequency weighting. Achieving wanted proportion sizes of respondent groups by univariate or multivariate (rim) weighting. You can select total N, impose restriction upon weighting individual cells or cases, weight several subsamples in parallel, take account of initial weights.

Categorical into Contrast
Categorical variables into contrast variables. Creates contrast variables from categorical variables, of several types, and their interaction variables. Contrast variables are needed first of all when one has to analyze influence of qualitative factors by methods designed for quantitative input (e.g. linear regression).

Various proximities
Various proximity measures. Calculation of a large number of measures of proximity or association (similarities, distances, correlations) many of which are absent in SPSS. Among them is Gower similarity for comparing respondents by quantitative and qualitative characteristics at once.

Matrix comparisons
Differences inside or between matrices. Macros compute a matrix of distances between matrices of proximity coefficients (rather than between variables or cases), - such as correlation or distance matrices; or between columns inside such matrices. These comparisons can help a researcher: for example, before a cluster or a factor analysis.

Fit covariates
Fitting variables to a matrix of coefficients. The macros modify variables’ values so that the variables have strength of relations according to a user-specified matrix (correlation, covariance, or cross-product). Option of insurance against heteroscedasticity allows to achieve homoscedastic relationships.

Cumulative curves
Cumulative curves. Macros that are related to analysis of cumulative distributions. One of them comparing, via cluster analysis, subsamples by shape of cumulative distribution in variables. Another macro – for marketing – analyses data of the so called price sensitivity meter (PSM).

Internal clustering criteria
Internal clustering criteria. Computation of indices, such as Calinski–Harabasz, Davies–Bouldin, Cubic clustering criterion, Ratkowsky–Lance, C-Index, correlation, Gamma statistic, Dunn (several types), Silhouette statistic (several types), AIC, BIC, and other indices helpful in choosing the better clustering partition, in particular, to decide how many clusters one should extract in a cluster analysis.

Compare partitions
Comparison of classifications/clusterings. Computation of various measures of likeness of groupings: external clustering criteria, classification performance and agreement indices. Identification of same or similar groups between groupings.

Euclidean space tools
Euclidean corrections and convertions. Macros for matrices of proximities that must be layed in euclidean or metric space. You can convert similarities (of a covariance/correlation type or interpretation) geometrically correctly into distances or vice versa; correct similarities or dissimilarities not fully satisfying space to ones satisfying it.
Job tools
Instruments facilitating work. Macros that are not connected with specific analysis or processing but rather serve to speed up various kind of job through syntax. One of them is an alternative to “SPSS Production Facility”, accelerating production of tables etc.

Regular clouds
Regular clouds. Creating multivariate data with regular, nonrandom structure. In particular, such data can be understood as fully no-clustered, unlike data generated randomly. Useful as model data in exploration of habits of one or another statistical algorithm, for example of cluster analysis.

Generate random clusters/mixtures
Random cluster/mixture data. Creation of random data consisting of clear clusters or mixtures (fuzzy clusters). Can make these clouds round or elongated, gaussian or platykurtic, regulate sizes and bodily closeness among them. A separate macro randomly rotates data in space.

Neighbourhood chains
Neighbourhood chains. Out of data showing pairwise relationships within a set of objects there is extracted the information about which object is referred to “in the first place” or “most strongly” by each given object. This way, a trajectory of sequential references is being built. It is shown in form of a table (adjacency list) and a dendrogram.

Make Paired samples
Pairing cases of two samples. Between two samples or sets optimal pairing is being done, such that the sum of within-pair differences gets minimized. Being used is Hungarian Algorithm for matching elements from two arrays into pairs.

Procrustes analysis
Procrustes analysis. Procrustes analysis for two configurations finds a way to maximally superpose two clouds of points in space, provided that a point in one cloud is designedly correspondent with a point in the other. Residual amount of mismatch tells of initial degree of non-identity of configurations. The analysis is used in tasks of comparing shapes and juxtaposition of ordinations (for example factor loading matrices – for detecting identical factors).

Plot latents
Adding latents as lines to data cloud. The macros show on scatterplot of data their principal components or discriminants – in a form of lines tiled with points, these latents’ scores.

Impute missing data
Imputation of missing data. The macros perform hot-deck imputation of missing values, borrowing valid values from cases which are similar to cases with missing data by some background characteristics. A separate macro performs an arbitrary, user-defined borrowing of values from some cases by other cases.

MATRIX — END MATRIX functions
Functions for MATRIX — END MATRIX. Large collection of useful statistical, mathematical, restructuring and other functions for matrix session in SPSS. For advanced users in the aid of data analysis and writing of statistical algorithms.

Clustering
Clustering. Macros for hierarchical cluster analysis (with options of constraint for a preexistent structure, precocious stop of agglomeration, and other), for computation of distances between already available groups/clusters and for assigning new objects to them. Macro for initializing cluster centres in K-means method clustering.
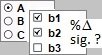
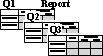
Compare proportions
Compare proportions. Comparing proportions of the categories defined by one categorical variable (“single response” variable) or proportions of the positive response in a set of binary variables (“multiple response” set). Results output is formatted similar to Custom Tables, and the procedure is apt for processing survey data.

Compare sequences
Compare sequences or documents. Comparison of sequences of elements with computation of a pairwise similarity measure between the sequences. In comparison, one may take or not take into account chains of elements or their location – i.e., compare as sequences of consecutives or simply as documents. You may choose which way to establish the similarity by: maximal matching, simple aligning, maximal common chain, etc.

Marginal homogeneity
Marginal homogeneity tests. Statistical tests testing a pair of variables as paired samples for equality of their marginal distributions or locations of those.

Analytic Hierarchy Process
Saaty’s Analytic Hierarchy Process. It is an investigation and analysis which allow to decide on a choice from the alternatives, when the ultimate goal is formulated and the hierarchy of subordinate elements logically leading to the goal is built, the alternatives being the elements of the lowest level of the hierarchy.

Clustering tendency
Clustering tendency. Some methods of exploration which allow to judge preliminary before cluster analysis whether there are clusters in the data. Block-diagonalization of a distance matrix between objects can suggest how many clusters there are. Hopkins statistic is based on simulations of random no-cluster data and comparison of these with the observed data.